
Updated Child COVID-19 Graphs & Statistics
- Long Covid Kids

- Oct 24, 2021
- 4 min read
Updated: Sep 27, 2025
Updated 24th October 2021
With thanks to:
James Neill. Charts and statistics @jneill
Ellie Tigress. Data @TigressEllie
Antonio Caramia. Interactive Dashboard @Antonio_Caramia and @TigressEllie
Infections in school aged children
Another record spike in cases
8% of Secondary school children are infected
4% of age 2 school year 6 are infected


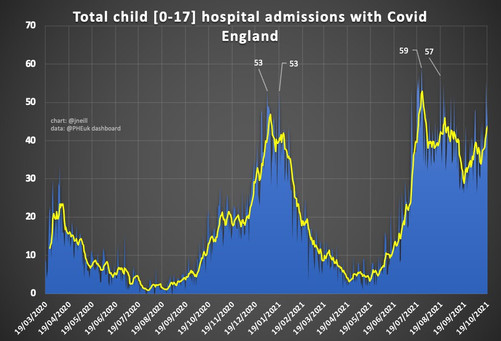
Child Covid Hospital Admissions
Excludes RSV which uses a separate test
Hospital admissions are now 74% higher for those aged 5 to 14 years than in January 2021 (ONS 22 October 2021)
1 in 163 infected children have been admitted to hospital since the pandemic began
Government research shows that 80% of admissions are directly due to Covid and 60% of those have no underlaying conditions.
COVID-19 is being taken into hospitals and GP surgeries by children
The delta wave has already caused more child Covid hospital admissions that the whole of the alpha wave. In fact it took just 148 days to exceed alpha's total admissions. According to government data 60% of child Covid hospital admissions had no underlaying conditions.
Unprecedented levels of Covid infection in children has also caused a 40% increase in Long Covid and we have yet to see the ONS figure for children following return to school in September.
Wave 2
1 Sept 2020 to 17 May 2021 (259 days)
4 357 children hospitalised with Covid
Wave 3
18th May 2021 to date (156 days so far)
4 738 children hospitalised with Covid
381 more children hospitalised in 103 fewer days


By Antonio Caramia with thanks to Ellie Tigresswith thanks to Ellie Tigreswith thanks to Ellie Tigrewith thanks to Ellie Tigrwith thanks to Ellie Tigwith thanks to Ellie Tiwith thanks to Ellie Twith thanks to Ellie with thanks to Elliewith thanks to Elliwith thanks to Ellwith thanks to Elwith thanks to Ewith thanks to with thanks towith thanks twith thanks with thankswith thankwith thanwith thawith thwith twith withwitwith thanks to Ellie Tigress wt ith ith it i
Paediatric Inflammatory Multisystem Syndrome
These hospital admissions are IN ADDITION to COVID admissions
These children are usually admitted after the 14-day testing cut-off
There were 720 PIMs admissions to the end of February 2021
@TigressEllie
Almost half of children in hospital, and a third with the late severe complication of PIMS-TS, had no underlaying health conditions
A quarter of children hospitalised for COVID-19 experience persistent symptoms on average 8.5 months after hospitalisation
Paediatric Deaths
98 UK paediatric COVID-19 deaths @tigressellie
3.3% of deaths in 10-19 year olds involved Covid. That is doubled from 2020
Long Covid in Children
In the UK we do not yet count Long Covid. We therefore, rely on estimates from research and lived experience. Different studies have different estimates due to use of different symptoms, number of symptoms, symptom durations, case ascertainments, population representativeness, and definitions of relapsing and remitting symptoms. Some studies have a control group and others do not. There is now a World Health Organisation agreed definition for Long Covid in adults. Long Covid Kids are participating in the process for a definition for children as part of the CLOCK study.
Sadly Mainstream media have long minimised Long Covid and usually choose the lowest prevalence figure published despite experts raising concern about the methodology gaps used in the research. Nevertheless, a small percentage of a large number should raise concerns amongst all.
Children are not supposed to become ill and die.
United States of America
“One year after becoming ill w/ the coronavirus, nearly half of patients in a large new study were still experiencing at least one lingering health symptom”
The CDC stated nearly half of infected children were experiencing Long Covid, and early research stated 43%.
Latest Long Covid Figures
1 month following infection has risen to 53 000 children
3 months 29 000 children
12 months 11 000 children
1 in 7 children (14%) infected with COVID-19 suffer Long Covid


Monthly Child Covid Summary
Month Cases Admissions Deaths Long Covid
0-19 yrs 0-17 yrs 0-19 yrs 28-day
July 271, 356 1,153 5 34,000
August 203,135 1,229 7 38,000
September 328,552 1,118 10 53,000
With thanks to @jneill
Long Covid ONS
UK Dashboard
New Interactive Dashboard with Children's Covid Data
By Antonio Caramia
Click image to link to site

Admissions
Cases
Deaths
For further details and to discuss graphs/stats contact James on Twitter @jneill
For further details and to discuss data collation/stats contact Ellie on Twitter @TigressEllie
For further details and to discuss the interactive dashboard contact Antonio and Ellie on Twitter @Antonio_Caramia @TigressEllie
LongCovidKids.org is a patient-led advocacy and support organisation led by Sammie Mcfarland for families of children with Long Covid. Our story started with a short film on the long-lasting symptoms of Covid in children.
We are supporting research with The Long Covid Kids Study with PeopleWith
Each Sunday we send out a newsletter providing a weekly round-up of statistics, the latest reports in the media, current research, and LCK news. Read previous issues and SIGN UP
If your child experiences any symptoms that indicate they are unwell, it COULD be COVID-19, and you should get them a test to help identify if it is a current Covid infection. Please see our Frequently Asked Questions page for more information.


